Last week I had the opportunity to participate in the LatinR 2019 conference in Santiago de Chile, a conference about the use of R in Research and Development. It was my second R-centered conference, after the RStudio Conf 2017, and I really enjoyed it.
In this post I will write first about the organization in general and, then, about some of the talks I attended. You can find the whole program here.
The conference was structured as most confs nowadays. It started with a day of workshops and then a couple of days of talks + keynotes.
I liked the structure and the way it was managed. The only issue I found was during the first afternoon of talks, because my selection of talks required me to move between conference rooms, and whenever I moved the talk had already started, before the time scheduled.
Workshops
There were 4 great workshops on the first day, two were run in parallel during the morning and two in the afternoon (also in parallel).
Morning:
- Teaching Data Science, by Mine Çetinkaya-Rundel
- Fast and Scalable Machine Learning with H2O, by Erin LeDell
Afternoon:
- Data Visualization with Highcharter, by Joshua Kunst
- Package Development, by Hadley Wickham
The 4 of them looked very promising, but I could only attend to one, so I picked the one from Hadley Wickham: Package Development. What a great experience to be trained in package development by the most prolific R Developer. Not only did he show us how to do stuff, but also gave us very good tips and explained everything clearly. And he made it clear since the beginning: we would end up the workshop having developed a package. And we did!
Now it is my turn to use that knowledge creatively to make my work much more efficient and, if things go well, to contribute to the open source community.
Keynotes
The keynotes were 45 minutes long talks focused on a special topic and given by an expert. During the conference there were 3 Keynotes:
R 4 All: Welcoming and inclusive practices for teaching (with) R, by Mine Çetinkaya - Rundel. This was the first keynote and given by a well known person in the R and Stats community.
It was an eye-opening talk for educators and students. Many tips she gave looked obvious, but just some of the attendees had applied them. For example, using a dark theme in RStudio when you are teaching or giving a talk might show you are “cool” but is not the best way to communicate. She also talked about the importance of diversity and how we can embrace it by using datasets that reflect that diversity or showing literature/documentation in different languages (so they get to pick what is more convenient for them). You can check her slides here.
Automatic Machine Learning with H2O, by Erin LeDell. Great talk given by one of the leaders in the field.
She showed the super powers of Automatic Machine Learning (AutoML) and how you can make use of it using H2O. AutoML takes care of the Data Preprocessing, Model Generation and even generates Ensembes. Then it returns the evaluation metrics for each of the models used, in a neat table.
You can make use of AutoML both in R and in the H2O GUI. It is definitely something you want to have in your Data Science Toolbox. You can check her slides here.
The Many Backends of dplyr, by Hadley Wickham. A really good talk given by the creator of dplyr.
He showed how you can make use of dplyr to work with “Big Data” by using the packages dtplyr and
dbplyr. What those packages do is translate your dplyr code to the corresponding data.table and SQL
code respectively. So, when working with a big dataset in data.table or connecting to a remote SQL
database, you just need to write your typical dplyr code and not worry about the different
syntax.
I have read about dtplyr and dbplyr in the past, but have never used them. Whenever I needed to
connect to a SQL database I just used SQL (from R). But after this keynote I am definitely going to
give them a try.
I couldn’t get the slides, but you can watch the talk here.
Talks
The talks were 15 minutes long with 5 minutes of questions. There were many interesting talks from a diverse range of speakers. What I liked the most was the diversity of the talks. I think you get the chance to learn more when things are explained from different perspectives, even if it is something you may already know.
I will only mention some of the talks I attended. And because this blogpost is already becoming too long, my descriptions of them will be concise.
The first day of talks started with 2 round-tables run in parallel:
- Data Science for Public Policy, which was divided in small talks
- Communities in R
I attended “Data Science for Public Policy” and there were 2 talks that caught my attention:
-
Experiences with Big Data when Processing 2017 Census, by Pablo Leon. He talked about data processing during the 2017 Chile Census and the challenges he faced. Some tips: Optimize your code because Performance Matters, Vectorization helps, use C/C++ if necessary, and Makefiles help to organize and optimize your code.
-
Using Big Data Technologies in Public Policy, by Patricio Cofre. He gave interesting examples of using this technologies in the Public Sector:
- Caso “Cero Papel” - Segpres
- Caso “Juicios Colectivos” - Sernac
- Caso “Observatorio Compras Públicas” - ChileCompras
Here some other talks during the rest of the conference:
-
Codificación automatizada de textos aplicada a la producción de estadísticas oficiales, by Ignacio Agloni, Klaus Lehmann and Verónica Canales. They made a really good point about the importance of a good text “codification”, i.e., classifying text in categories according to its content (e.g. Groups, divisions, etc.).
-
Fuzzy merging with company names, by Richard Vogg. He talked about different techniques, like using string similarity, for fuzzy merging of complex datasets.
-
Auto-Keras: An R easily accessible deep learning library, by Juan Cruz Rodriguez and Javier Luraschi. Great talk about the use of Keras for AutoML, using the R Package
autokeras. In his talk he engaged attendees with a great example: using autokeras for the classification of emojis (Image Classifier). And there was even a Shiny app to try out the Classifier that was built. -
alicer: Creando un paquete con soluciones analíticas para Walmart Chile, by Francisco Albornoz and Francisco Benavides. Great talk about the development of a package for Walmart Chile, with the goal of making frequent operations/analysis/DB-queries much more efficient. The package even has Rmd templates for reports.
-
Uso de R en ambientes productivos, by Tomás León. He showed how you can leverage Docker, H2O and R to work in productive environments.
-
Abriendo y analizando los Diarios de Sesiones del Parlamento uruguayo con R, by Daniela Vazquez. Using some web scraping and processing PDF files, she was able to do sentiment analysis of the sessions in Uruguay Parlament.
-
Open Trade Statistics: Database, API, Dashboard and Utility Program made with R, by Mauricio Vargas. Great set of tools for accessing and analysing international economic trade data (more specifically: commodities).
-
Datascketch: Herramientas web para limpieza y visualización de datos, by Camila Achuri and David Daza. A Shiny app for visualizing and exploring data, focused on non-technical people. I loved the UI and the tools available.
-
GCM compareR: una aplicación web para evaluar escenarios de cambio climático, by Javier Fajardo. A great web app for exploring and comparing General Circulation Models in climate change. This is of great interest to researchers and students of Climate Change. However, due to the complexity of the app, this can also be of great interest to Shiny developers and learners.
-
Predicción de precios de la vivienda. Aprendizaje estadístico con precios de oferta y transacción, by Pablo Picardo. Good talk about different approaches for modeling housing prices using Statistical Learning. He used data from the web (websites offering housing) and transactional data from the government.
-
R en movimiento: una revisión de los paquetes para analizar movimiento dirigida a usuarios y desarrolladores, by Rocío Joo. She was able to track every R Package for Movement Analysis and showed the pros & cons common to most of them.
As I said previously, there were many interesting talks. However, in this blogpost I just wrote about some of the ones I attended. Check the LatinR website for the whole schedule and its repo for the slides + posters (they mentioned they will be available in this repo).
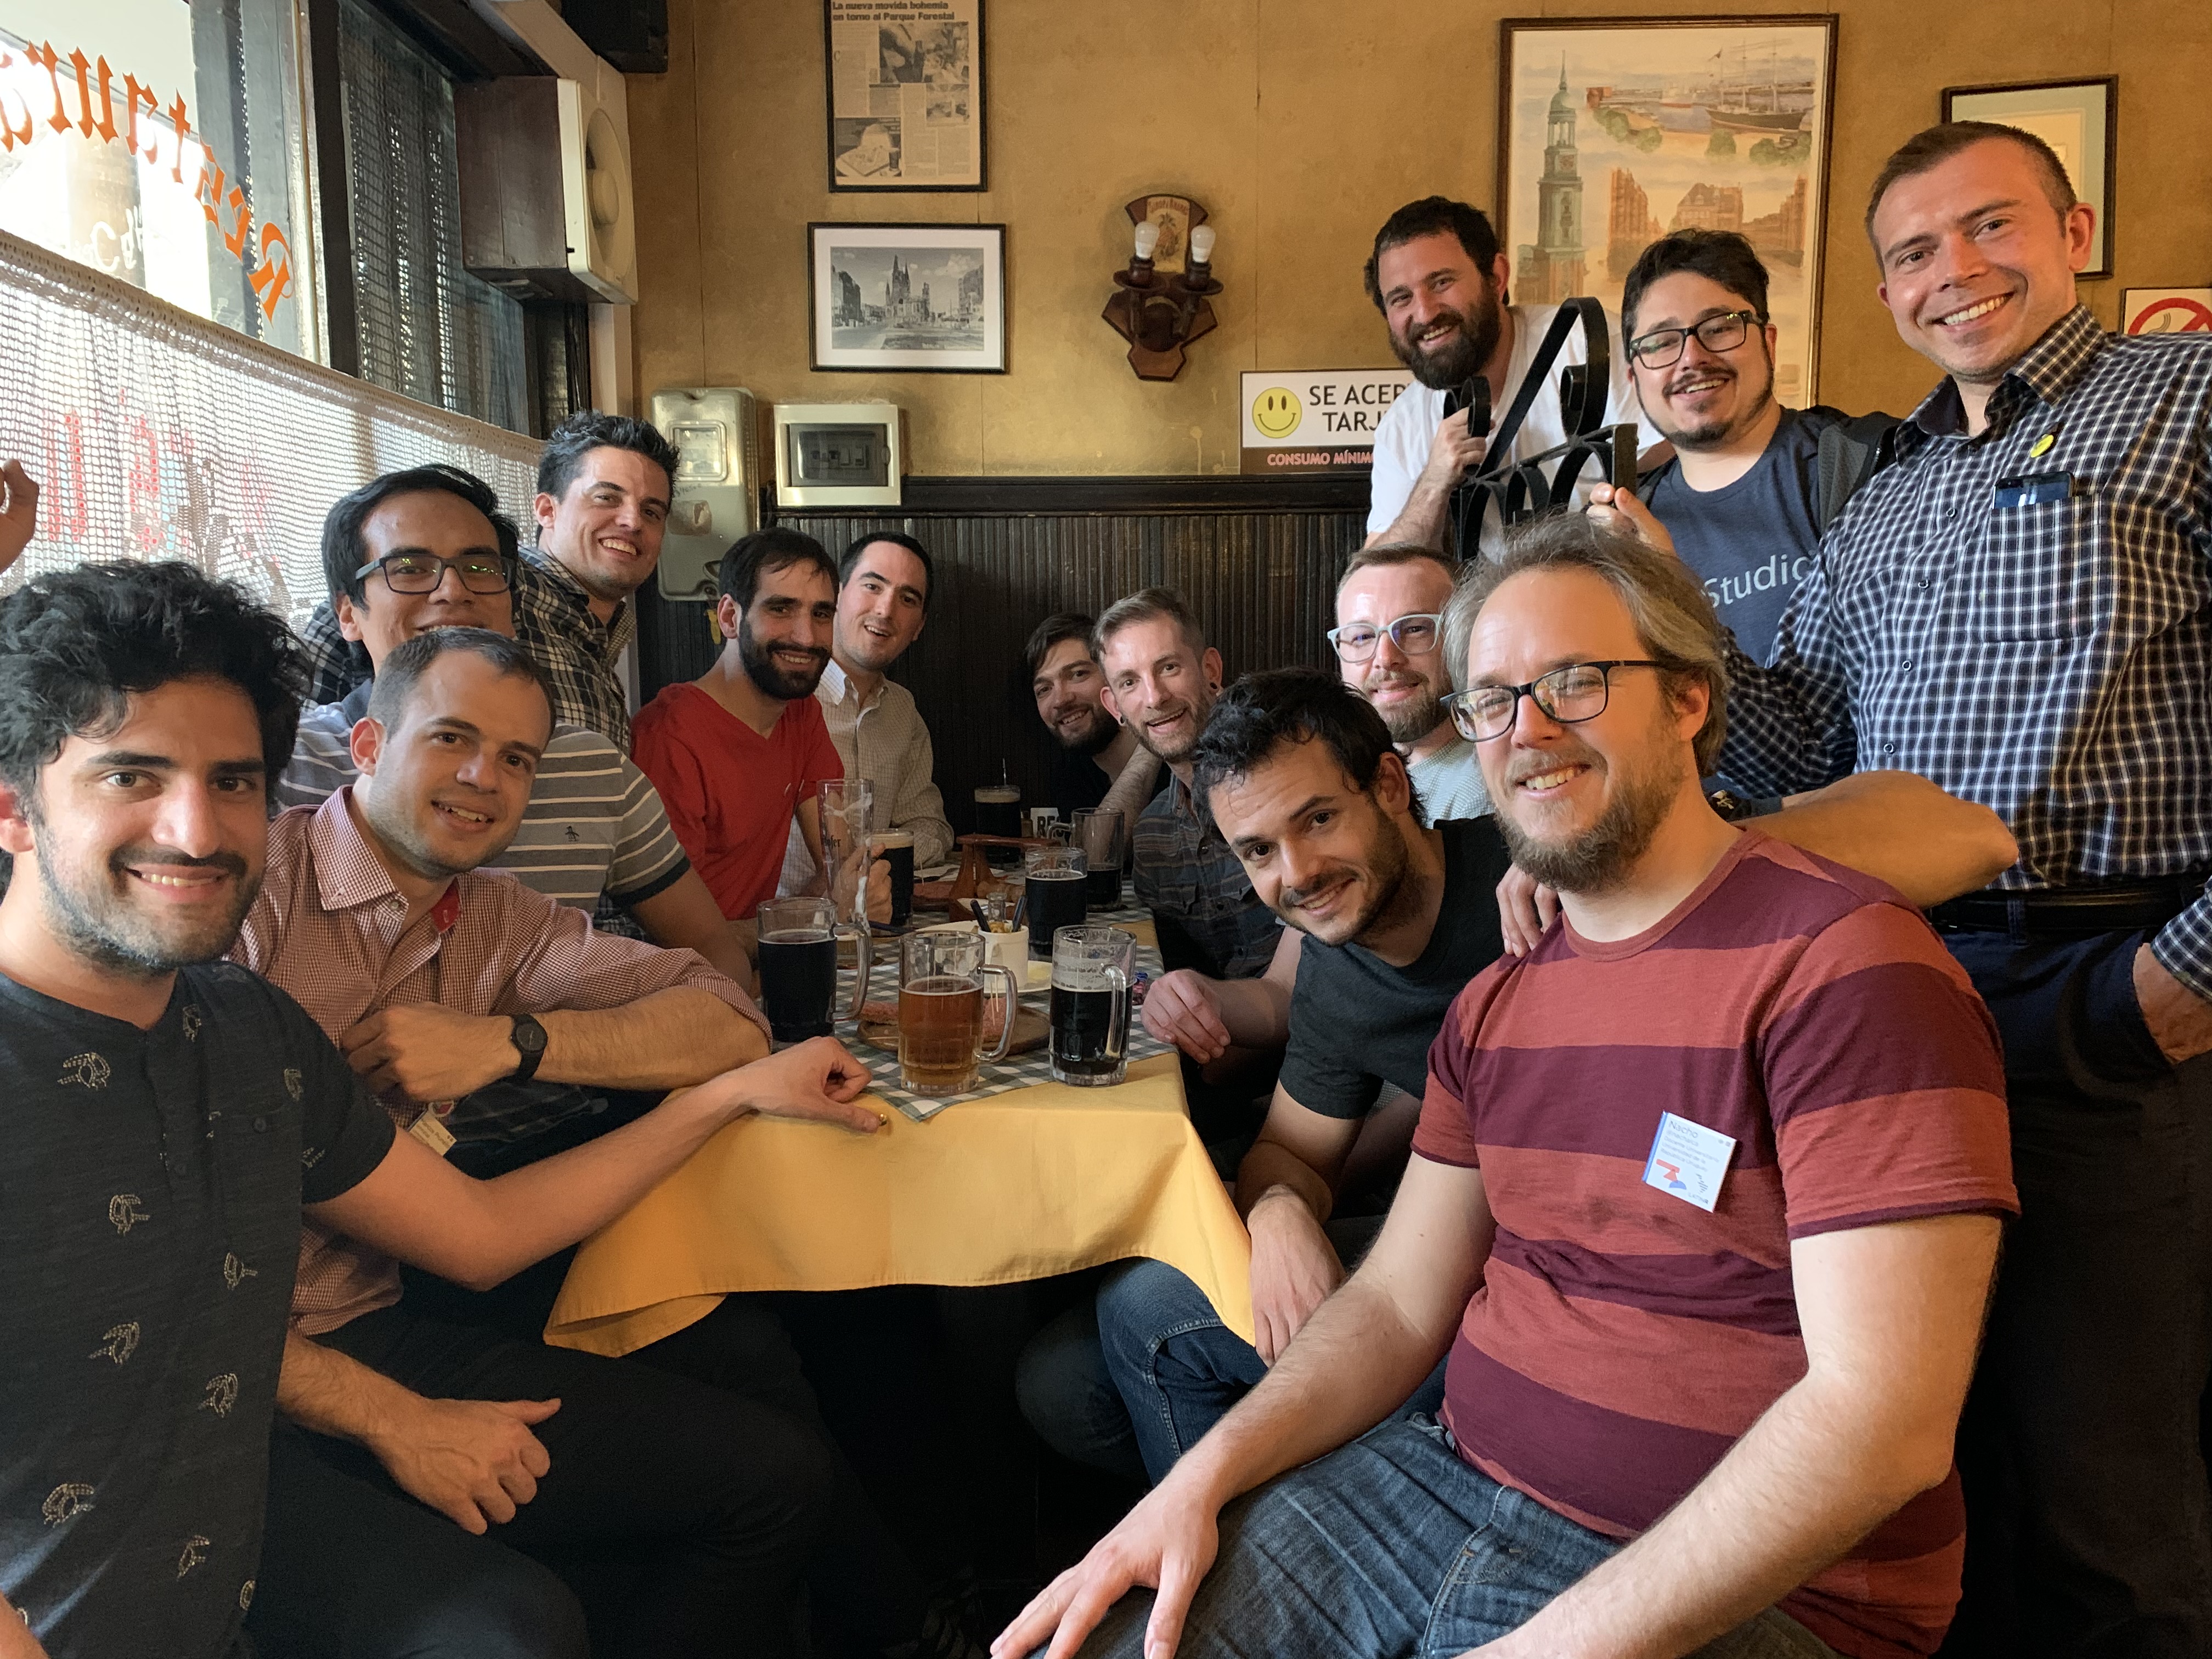
Finally, here is a pic of the first day, after the workshops. Do you recognize anyone?
Yes, there is a celebrity in that image :D
And yes, we are males only, but that is because the RLadies community had a meeting at the same time.
Bonus
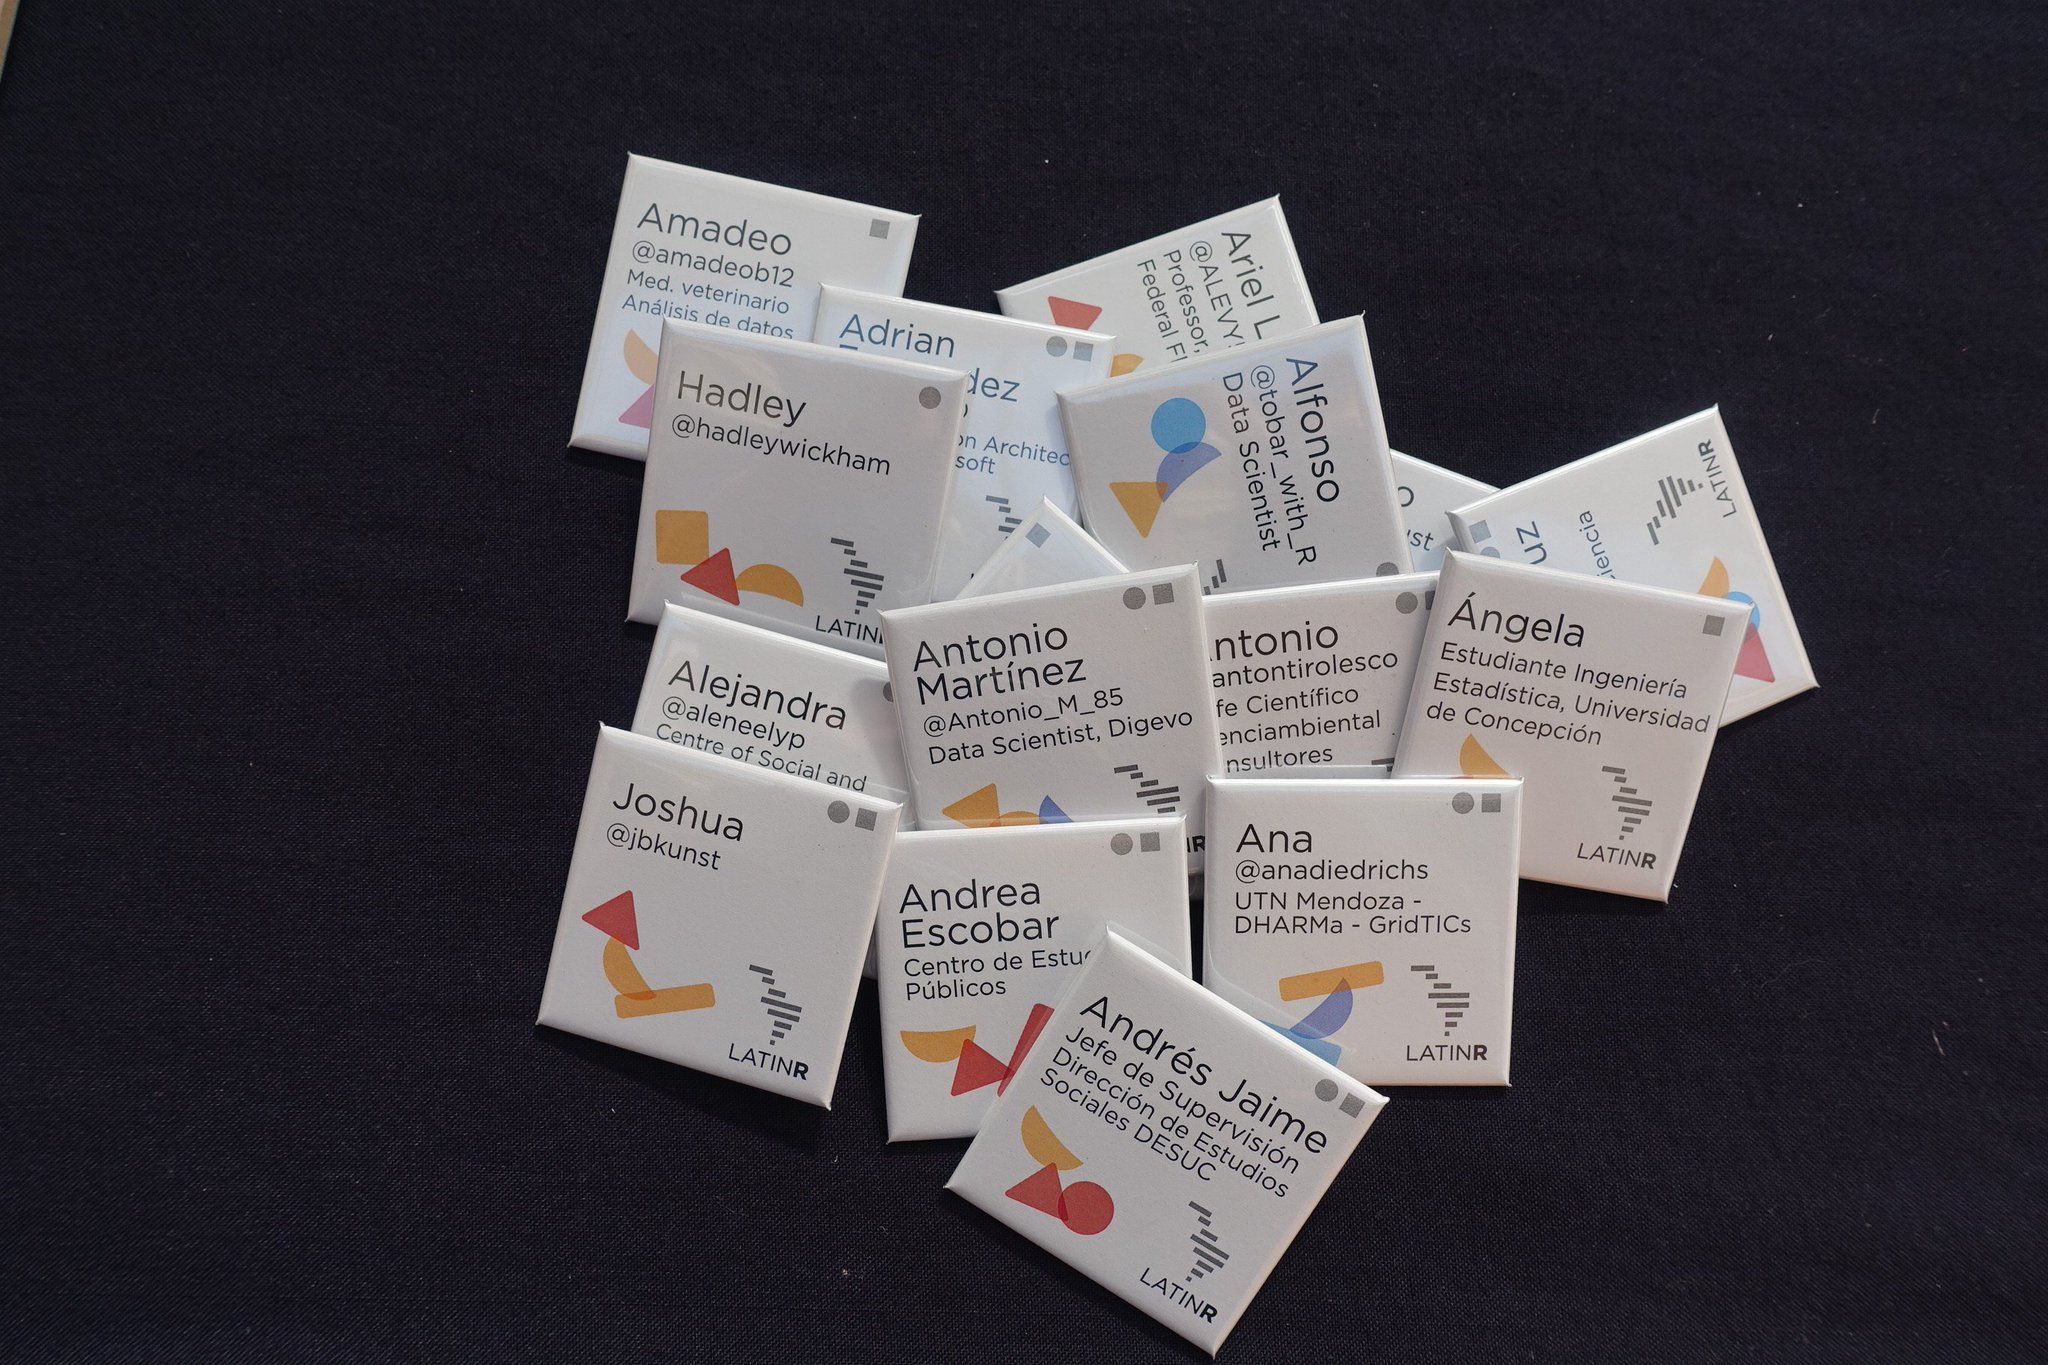
Riva Quiroga did a great work with the badges:

Every geometric figure represents something about the person, so you can find your matches (people with similar interests). You can check her tweet with explanations here.
Thanks
Big thanks to the organization and sponsors for such a great conference.
And thank you, the readers, for reading this blog post.
